
A little over a month ago I published some empirical Goal Kicking Accuracy maps that looked at the likelihood of kicking a goal from each spot on the ground. Shots were split into two categories, set-shots in one, everything else in the other.
Knowing the amount of high quality shots each team takes, their “ExpScore”, gives us a new way of analysing matches. As footy fans, we already say things like, “they were the better side, they just didn’t capitalise on their chances”, ExpScore just gives us a framework to quantify just how much better their chances were. I have developed some graphics that I think will help in this analysis, check back tomorrow to learn more about them.
Since that original article went up, I have been playing around with ways of better assessing the quality of each shot taken in a match. The empirical GKA maps are patchy and ugly. How can we use some basic logic so that one shot has essentially the same chance of a goal as it does if we moved 50cm to the right, regardless of whether we have much data from that exact point on the ground or not? Also, not all open-play shots are the same. How can we better categorise them?
In order to do this I have fitted some logistic regression models to data from 2012-2015. If you don’t know what a logistic regression is, don’t stress, I won’t go into the mathematics of it here. All you need to know is the model gives us a percentage likelihood of a shot being a goal based on a few criteria. If however you are interested, I’ll post my coefficients in the footers and references of this article.
Different Types of Shots
I’ve chosen to break down shots into four distinct types. You will see later that there are other predictors I use to help further differentiate shots, but at it’s core, every scoring shot in footy boils down to one of the following four.
- Set Shots. The simplest and most immediately obvious type of shot in Aussie Rules. The player gets 30 seconds to go back and take their shot. They kick over the head of a man on the mark. Shots where “play-on” or “advantage” have been called do not count as set shots.
- Ground Kicks. Shots where the player has not taken possession of the ball before shooting, but instead just kicks it at the goal straight from the ground. Usually taken pretty close to the goalmouth.
- On-the-run Shots. These are shots where the player has run at least 10 meters towards the goal after gaining possession before shooting. An added stipulation is that they do not reduce their angle to the goalmouth by more than 5° before shooting. These types of shots are often accompanied by a bounce and usually suggest that the player has time and space to think about the shot before taking it.
- Other Shots. Anything that does not fit into the above categories. As you will see, there are ways to differentiate between these shots as well, but as there is some overlap, I group these all as one “type”.
Each of these different categories has different bits of information that are useful in determining the quality of shot. I’ll get to each of these as they come up. But first, I’ll start with the easiest to explain, Set Shots.
Set Shots
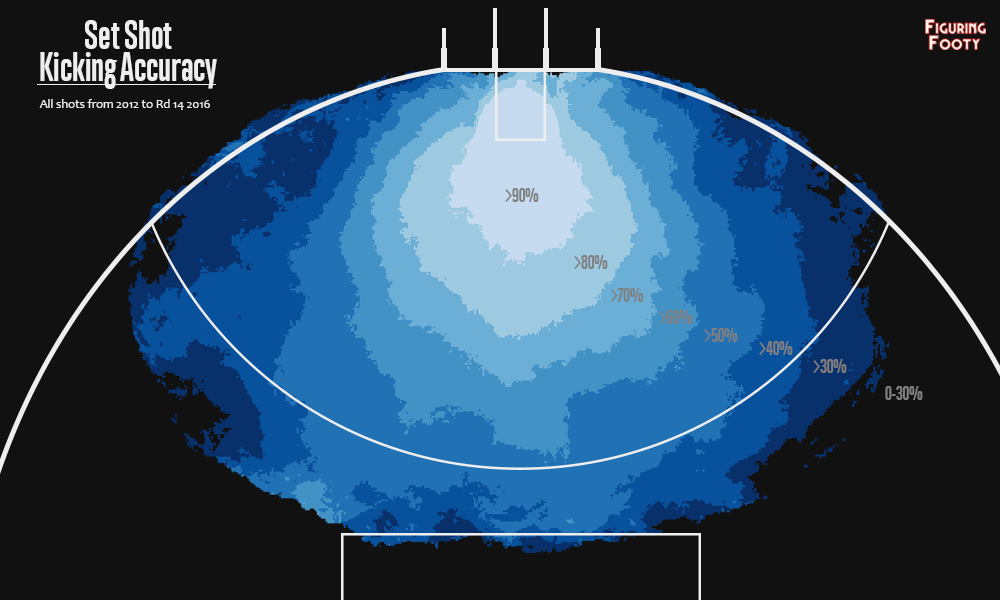
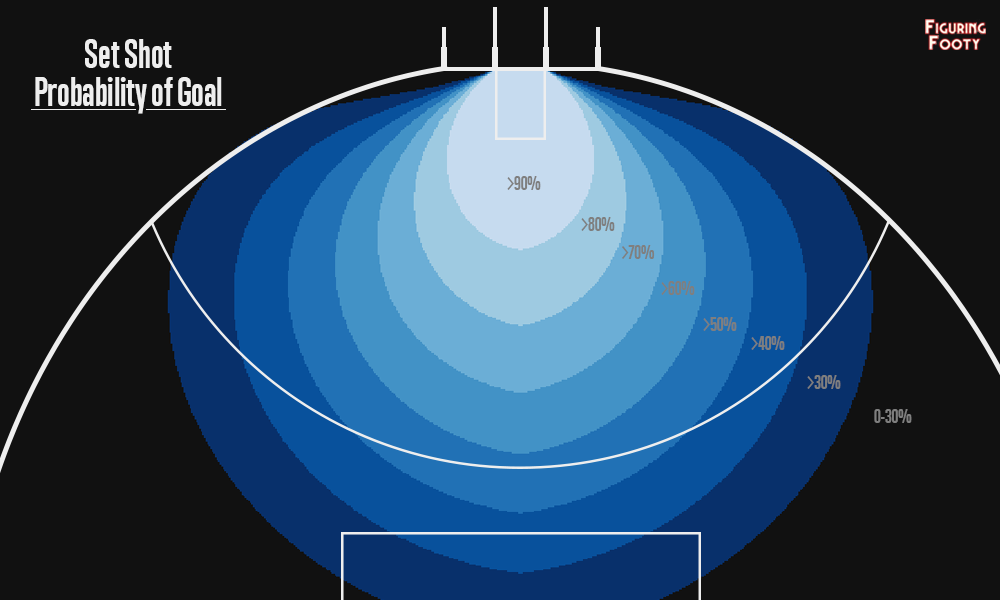
The likelihood of a Set Shot being a goal1 can be predicted reasonably accurately by looking at the distance and angle the shot was taken from. Here you can see how much of a chance the model gives set shots from different positions on the ground.
If you overlay this image with the historical set-shot conversion map from the other article, you can see they are very similar. What makes this one special is that instead of rating a shot based on the history of all shots from that place on the ground, this rates a shot based on a simple formula that requires only the distance from and angle to the centre of the goal.
Calculating the probability of a shot from a certain distance and angle is slightly tougher than just adding two numbers, but not much harder at all if you know what you are doing. First, all regression on this page uses a “logit transformation”, this just means that to calculate the probability we must sub our formula into this expression:

The formula that we sub in has four terms. These are distance to goal, the natural logarithm of distance to goal plus 1, the angle to the centre of the goal, and finally the visible angle subtended by the goalface at that point on the field.2
To get a sense of what this last term means, imagine holding a football out in front of your face and seeing how big it is compared to the goal. If you are far out or at a tight angle, the footy may cover the whole goalface. If you’re close in, right in front, it’s likely the goal will appear much bigger then the small footy. All else being equal, a larger visible angle, an easier shot.
There are other formulas and forms that will give slightly better prediction, but these four seem to be a good trade-off between accuracy and simplicity.
One very important thing to note when looking at these maps and calculating shot probabilities is that all of these figures are based off the outcome of past scoring shots. That is, shots that actually registered at least a behind. Unfortunately I don’t have data that shows shots that were taken but did not score either because they fell short and were not rushed through or they were kicked out on the full. I also only include rushed behind shots that were knocked through, not ones where the defender took possession before conceding. This changes the way we should think about these figures.
If we know that a shot scored at least a point and was not touched, then theoretically even for the worst kick, we still have about a 33% chance of kicking a goal. It could go left, it could go right or it could go centre.3 Adding in the possibility of being touched on the line, which of course is more likely the further out you are, this probability decreases. This is how we can get areas that have less than 30% likelihood. Even if we know there is a score coming from one of the black areas, it’s still less than 30% chance it went through the goals and was not touched on the way.
If we accounted for out-on-the-fulls, the conversion probability, especially from tough angles, would be a lot lower. But I guess we have to make do with what we have.
Ground Kicks
Ground shots are very rarely taken from anywhere further out then about 20 metres and the model optimises for this.
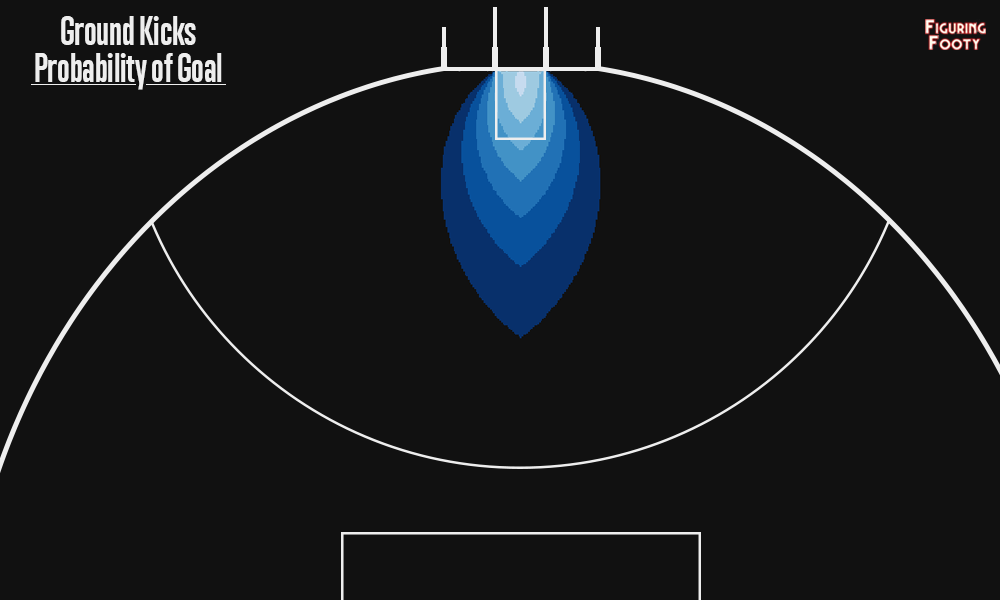
Ground Kicks are certainly the odd one out among all shots. They seem to be modeled best by just looking at the angle to the centre of goal and the natural logarithm of the visible angle subtended by the goal.4 The bounce of the oval ball is so unpredictable that it seems like being central to goal is the key to a good ground shot.
On-The-Run Shots
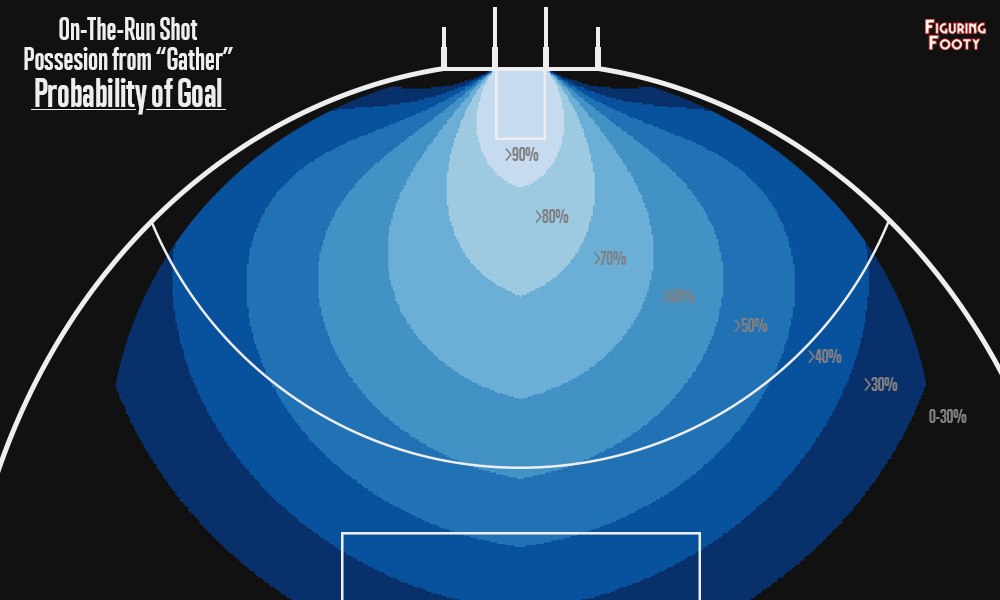
Splitting up other types of shots becomes a little bit tougher. It would be unfair to treat a shot from a player strolling into an open 50 as the same as a shot taken out of the ruck with 2 players hanging off either arm. Unfortunately, I don’t have any data that records the nearest opponent, or even if the player was currently being tackled, so we need to think of different ways of categorising shots so that we can infer the pressure that a player was under and how difficult the shot really was. My first attempt to do this involves splitting up shots where a player has run at least 10 metres towards the goal from where they first gained possession.5 These shots hopefully indicate a level of time and space that makes for an easier shot than other shots from open-play.
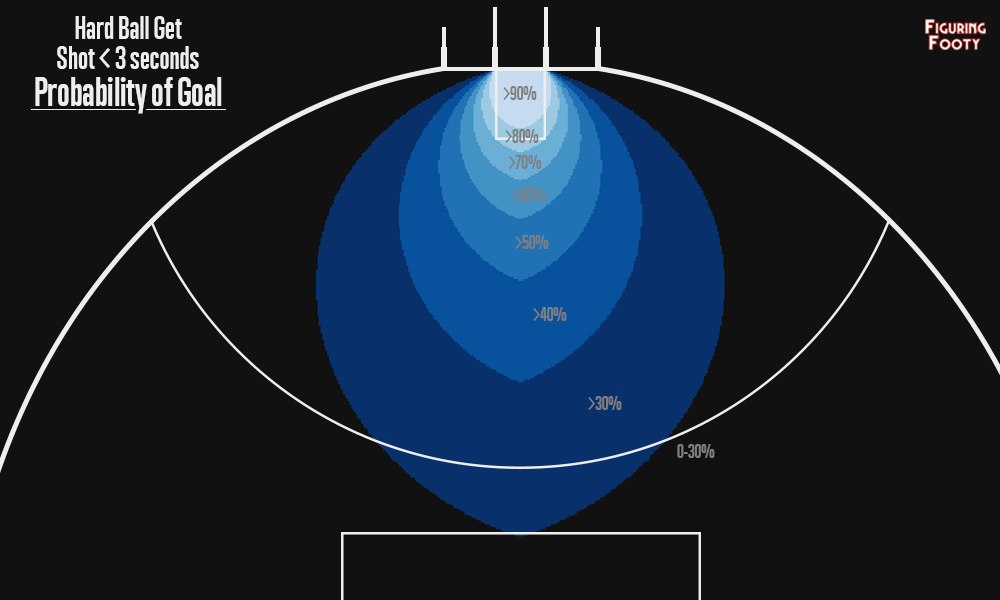
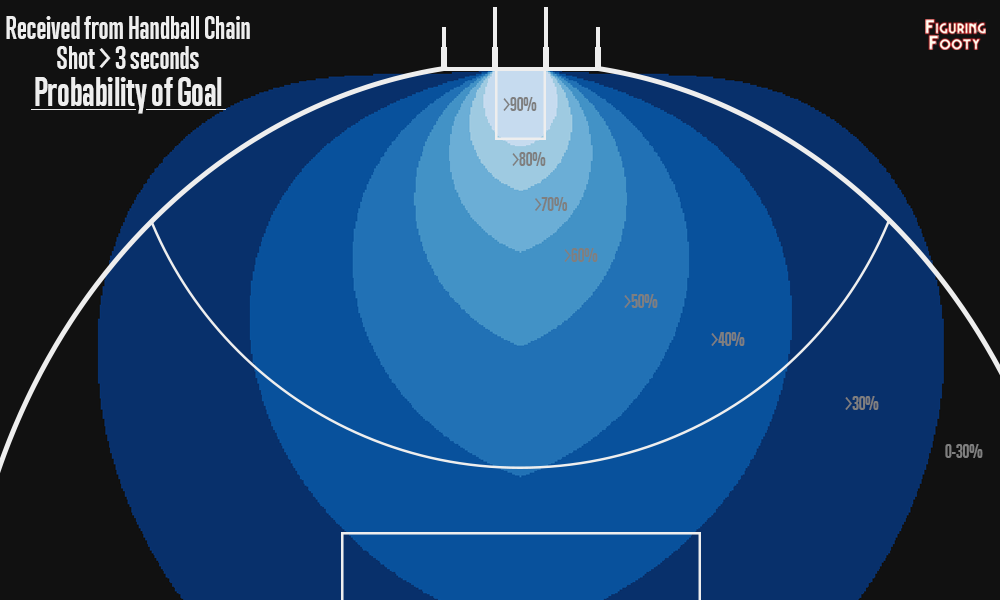
For shots from open-play (excluding ground kicks), we can also look at how the player gained possession in order to tell us a little bit about the likely pressure around the ball and the difficulty of the shot. I look at seven different ways a shooter gains possession:6
- Hard Ball Get – From Champion Data: “A disputed ball at ground level under direct physical pressure that results in an opportunity to effect a legal disposal.”
- Loose Ball Get – From CD: “A disputed ball at ground level not under direct physical pressure that results in an opportunity to effect a legal disposal.” Still a contested possession, but differs from a Hard Ball Get as the player is not about to be directly tackled but rather may have a few steps to take.
- Hit-Out Claim – Taking the ball directly from a hitout (ball-up or throw-in). Can be taken directly from the ruck, but usually comes from a teammate’s Hitout to Advantage.
- Gather – Gathering an uncontested possession, not coming from a mark or an effective handball. Imagine a player running onto a loose ball on the wing. This is a gather.
- Handball (1/2) – Received a handball as either the first or second player in a possession chain.
- Handball (3+) – Received a handball as the last player of a possession chain that included at least 3 other teammates. Received a handball from a player that received a handball or kick from a player that received a handball or kick. A long possession chain suggests that your team has opened up the defence somewhat and it is likelier that you have more time to shoot.
- Play-On or Advantage – Chose to play on after a mark or a free kick. Usually suggests a high quality shot.
We use these categorical variables in our logistic regression as well as whether the player took a bounce or not. A bounce indicates more time and a likely easier shot.7
As you can see from the map, likelihood of goal when close in is significantly worse than what it is for a Set Shot. However, as we move further away the probability is actually higher. This is because a shot from open play, if we know that it has scored at least a point, is more likely to have got there without being touched than it is when we have a Set Shot and the defence has time to get back. Knowing that it scored, we know it’s more likely to be a goal.
Other Shots
Now it’s time to look at all other shots. We’ve taken out three distinct types of shots but we’re still stuck with over 25% of all scores to try and somehow predict and categorise.
For these shots, along with the 7 categories of possession I used before, I also include two new predictors. Firstly, I see whether the player has performed a successful “baulk”. For those that listen to Brian Taylor, you might know this better by it’s modern day name, “hand candy”. A baulk usually means the player has opened up space and has a relatively easy drop punt chance.
The second new predictor is whether the time from when a player first gains possession to when they shoot is greater than 3 seconds. The theory is, more time, greater chance to steady and kick.
As you can see below, changing just a couple of these variables can drastically alter the probability that a shot from any specific spot on the ground is a goal.8
Note the increased probability for shots near the behind post relative to Set Shots from the same angle. This reflects the added ability to dribble the ball through along the ground which is not available when there is a man on the mark.
Closing Thoughts and Limitations
I could keep talking about this and posting new scenarios and images and graphs for ages, but this article is coming up on 2500 words already, so it’s time to wrap up. Keep your eyes posted for some new articles as well as some individual match analysis as we begin to move into the finals. Follow me on Twitter if you don’t want to miss a thing.
I’ve provided a framework here, which anybody is free to use, from which we can begin to answer questions like; “Is it worth chipping wider to a teammate a bit closer to goal, or should I have a crack myself?” and also “Where and what type of shots should our defence attempt to limit?”.
I lament the fact that more detailed and accurate data is not made available to the public.9 As I mentioned earlier, none of these maps factor in shots that went out-on-the-full at all. This should be a crucial element to this sort of analysis. I am also aware that the data that I do have contains errors, I’ve caught many myself, but do not have the time to go back through 50 thousand shots.
It’s also important to realise that these shot maps do not factor in individual player ability at all, but rather view the AFL cohort as one. Set Shots from 55m out do not have a 50% chance of going in for every player, but rather the players that have scored from that far out, convert to a goal about 50% of the time. I also don’t have any data on the left/right footedness of players, so treat both sides of the goal as identical. There was some evidence in the empirical maps to suggest that conversion is slightly higher to the left of goal. Most likely because there are more right footers, and they can open up the angle better.
All that standing, I hope this article is somewhat useful to you and I hope that Shot Quality can be used as way to more intelligently discuss footy games in the future.
- given that it scored at least a point. This is an important distinction that I will discuss in a moment.
- The formula for set shots is -6.4227 – 0.0716(distance) – 0.0074(angle) + 2.2778*log(distance +1) + 0.1902(subtended angle). Using this and the transformation above you can get a fairly good estimate of how likely a shot from a given point on the ground is of being a goal.
- Not thinking about the possibility of it hitting the post for simplicity.
- The formula for ground kicks is -4.2815 – 0.019(angle) + 1.4438(log(subtended angle)). Once again, use this with the logit transformation to get a goal probability.
- I also only include players that have not decreased their angle to the centre of goal by more than 5°. This helps remove those players that are running sideways to the pockets in order to evade tacklers. This is not the idea of an On-The-Run Shot.
- A lot of these are subjective and as different people tag different games, it’s not a surprise that sometimes there are differences in classification as well as mistakes. Still, as I continue saying, it’s the best we have, and certainly a lot better than just ignoring how the player gained possession.
- The formula for for On-The-Run Shots contains categorical variables as well as a binary variable. To calculate the probability yourself using the logit transformation, include a 1 for when that variable is true and 0 for when it is false. Each shot is in one and only one of the 7 categories. The formula is -8.2413 – 0.0811(distance) – 0.0059(angle) + 2.9523(log(distance + 1)) + 0.1409(angle subtended) + 0.1209(bounce) + 0(gather) – 0.4876(hbg) – 0.2517(lbg) – 0.1962(ho) – 0.3134(hb1/2) – 0.2095(hb3+) – 0.1292(po/adv)
- The formula for Other Shots is -1.5153 – 0.0235(distance) – 0.0064(angle) + 0.5132(log(distance + 1)) + 0.0738(angle subtended) + 0.2593(baulk) + 0.0672(time>=3) + 0(gather) – 0.5912(hbg) – 0.1804(lbg) – 0.2187(ho) – 0.0618(hb1/2) + 0.1021(hb3+) + 0.4095(po/adv)
- But also understand that Champion Data’s primary business is selling data to clubs.