
Every week during the season, I post match predictions for the upcoming round. These are in the form of a percentage probability and give the “chances”1 of the home team winning each match.
[table “4” not found /]These probabilities are calculated using 3 main inputs:
- Home Ground Advantage (HGA) which increases the likelihood of the home team winning. The HGA is larger when the away team has to travel further. It also takes into consideration the amount of games that each side has played at that particular venue over the last 2 years, further favouring the team that has more experience on the ground.2
- The home team’s Figuring Footy Scoring Shots (FFSS) rating, and
- The away team’s FFSS rating.
FFSS is an Elo rating system with a few notable twists. If you have never heard of Elo before I suggest reading about how a very simple AFL Elo rating system works. After that, it would be wise to acquaint yourself with the FFSS rating system in a very broad way. I will write more about FFSS at a later date, but for now that should get you on roughly the right page.
For those that don’t want to take the time to read two 1000-word articles I’ll try and quickly sum up FFSS for you.
When a game of footy is played, we learn a little bit about the quality of each side. The team that wins has shown us they have a certain level of quality. If we already rated that team highly, and the win was a rather routine, no-frills result against a much lower ranked team, then we were probably pretty accurate with our ratings from before.
However, if we rated that team a bit lower and they pulled off an emphatic win against a highly ranked team away from home, then that suggests that we may need to adjust our ratings upward.
FFSS tries to take a mathematical approach to this idea. It considers our prior predicted chance of winning, the actual result and margin, as well as the quality of chances that each team created3 and gives us a value by which to adjust our rating of the winning side upwards and rating of the losing side down. These ratings are then passed on to next week and used in predictions for games played next round.
The average rating of all teams is 1500. As a rule of thumb, a difference of 120pts means the higher rated team is expected to win about 2 out of 3 times if the two sides were to play many times. A 380pt difference suggest the higher rated team would win 9 out of 10.
In general interstate HGA equates to between 80 and 110 points. HGA between teams from the same state is usually between 0 and 20. But these values do change depending on team experience at grounds.
Updates
The FFSS ratings system is currently still a working prototype and improvements will be made throughout the year. I will list any of these below. Follow me on Twitter for notifications of any updates.
- 31/05/16 – v1.1 – I have made a slight tweak to how the margin multiplier4 is calculated, particularly in close games. Previously a winning margin of say 4pts was considered unrealistically better than a margin of 5pts. The distribution is now flatter and which gives a multiplier more in-line with what a human would give.I have updated the ratings using the new system. Most teams remain within 1 or 2 pts of where they were before. Carlton are the big movers, jumping up 10pts due mainly to a higher weighting of their close wins against both Fremantle and Port Adelaide.

Old Ratings 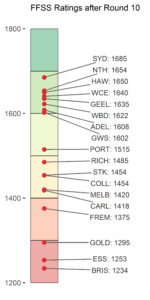
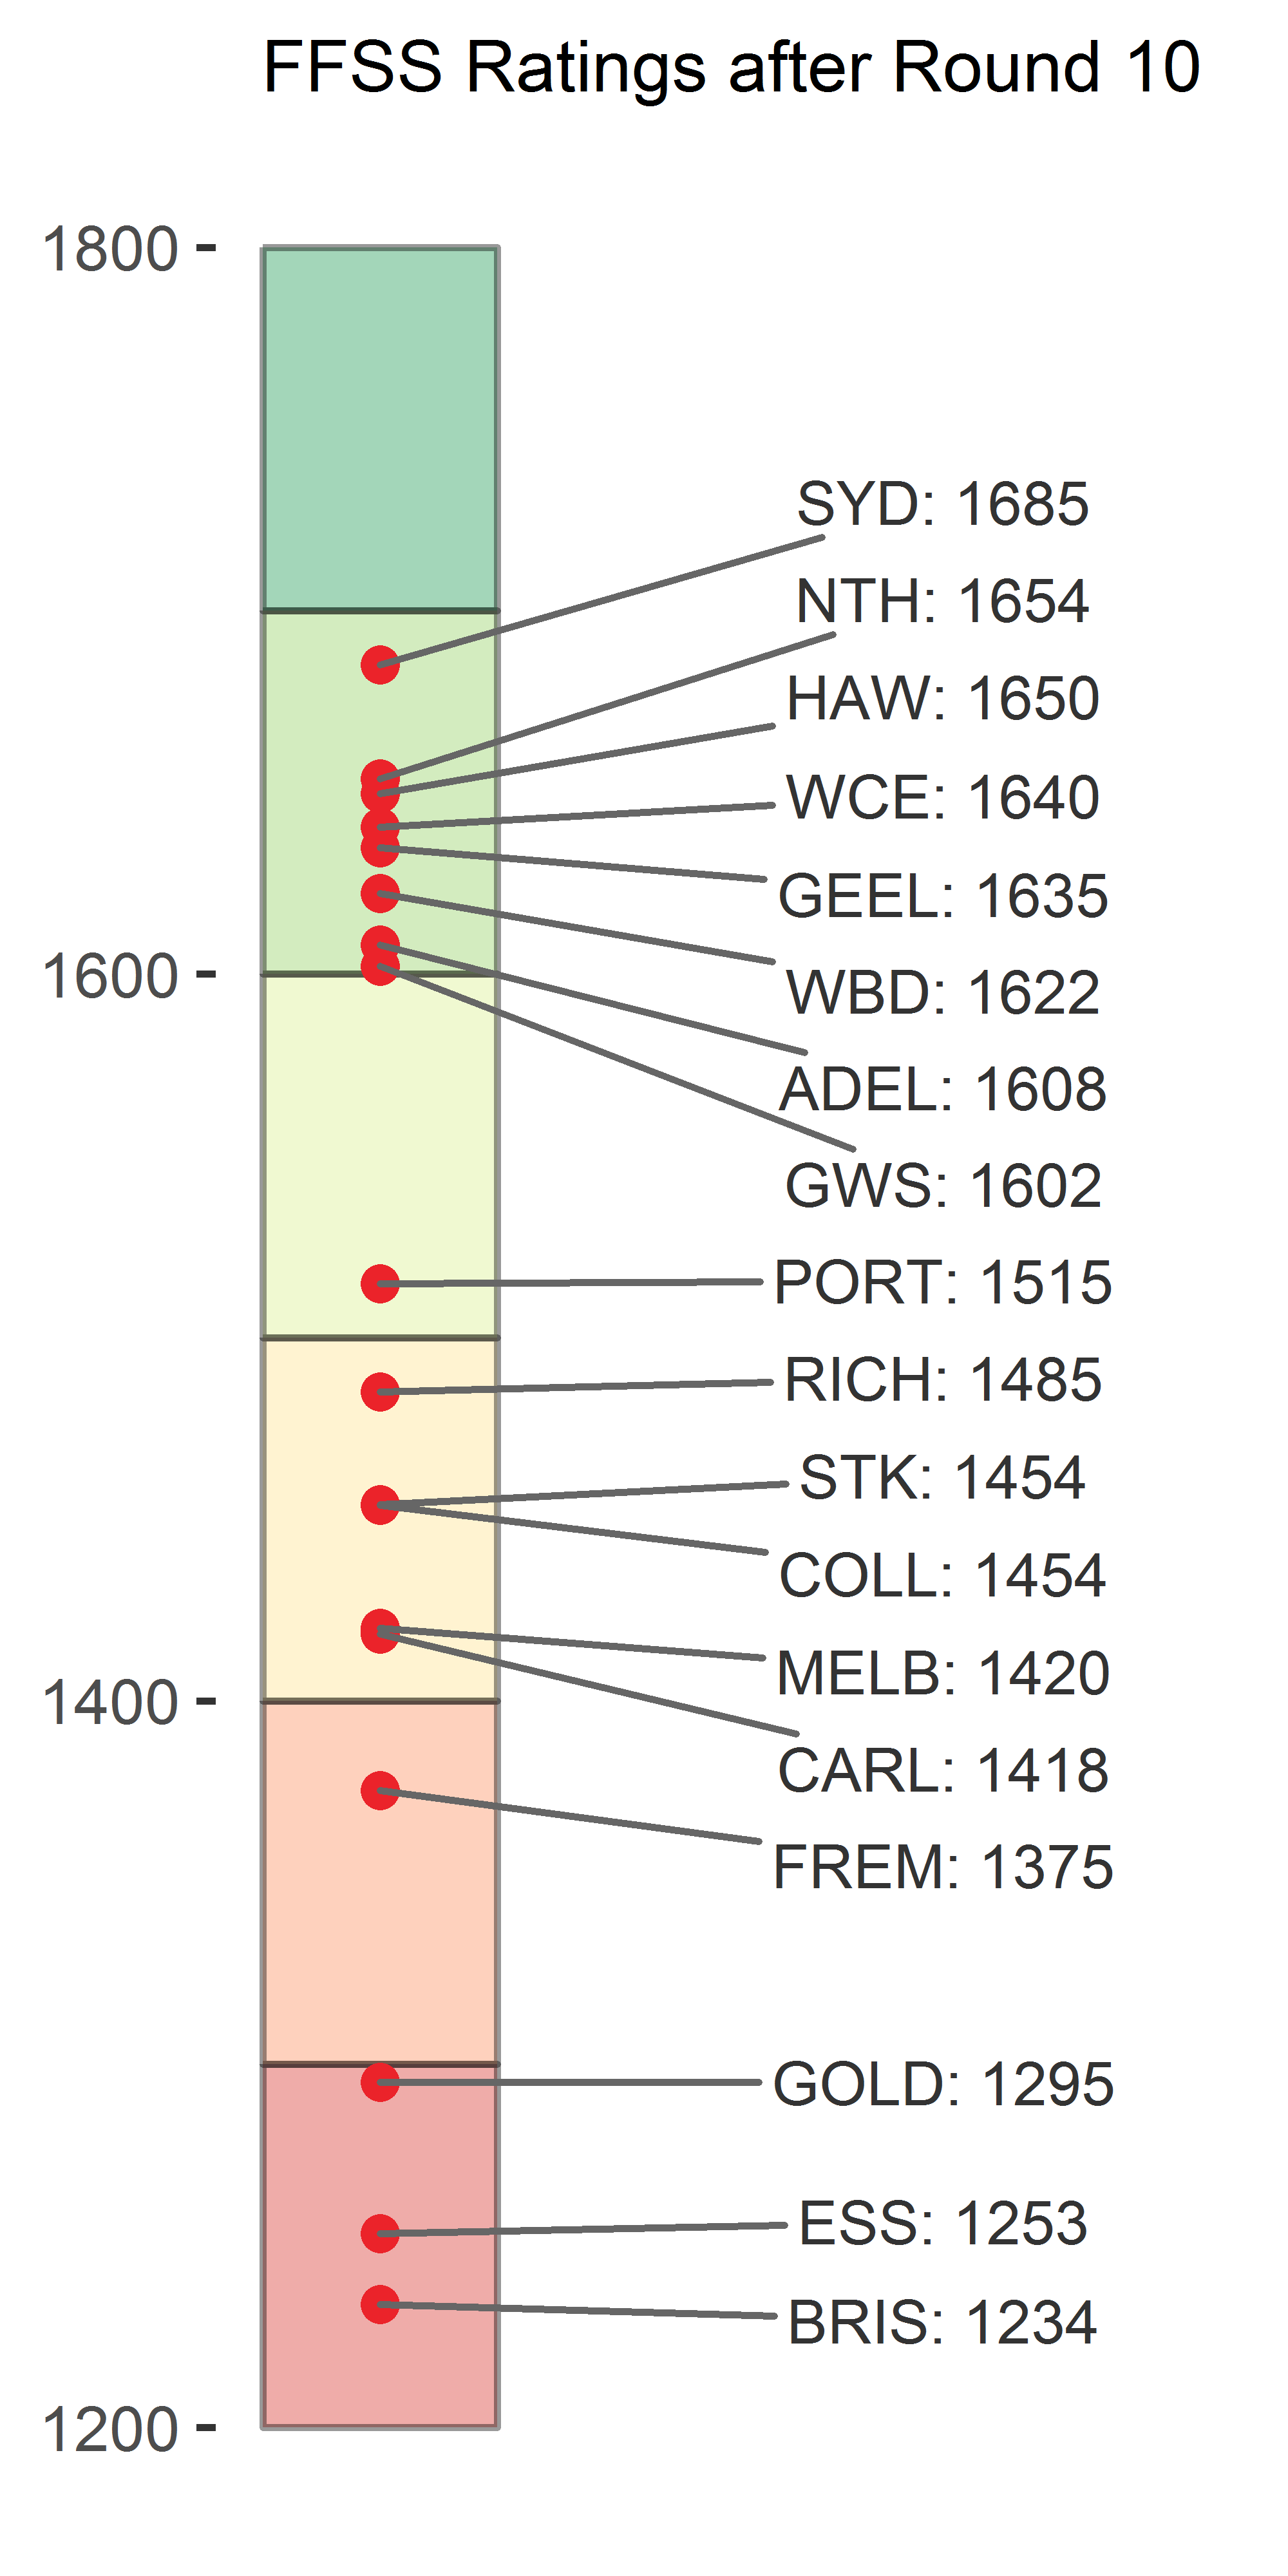
Updated Ratings

- From 1% to 100%
- This also helps us account for the crowd affect. If a team plays many games at one venue, they likely get a fair proportion of the crowd there.
- Because if you only won because the opposition butchered all of their set-shots, you probably got lucky and shouldn’t actually be rated much higher than you already were.
- How much does the margin affect the rating change