
I spend a fair bit of time here developing ratings to compare team quality beyond their simple win/loss record. But I’ll let you in on a little secret: that commonly overlooked “percentage” column at the right side of the ladder often provides just as good a benchmark of which teams are playing well and dominating games and which teams are scraping by due to lucky wins.
Hawthorn’s drop-off this year has been stark, but the truth is the signs of the end were there long before Mitchell, Lewis and Hill walked out the door. Their percentage after finishing in 3rd place last year was only 118.6%, considerably lower than GWS, Adelaide and West Coast in 4th, 5th and 6th and only marginally higher than the Dogs in 7th and even Port Adelaide in 10th.
You can spin whatever tale you like about Hawthorn having the class to win the close ones1, but from a team that has had either the best or second best percentage in the league over each of the previous 4 years, 118% told a much more accurate story than 3rd place on the ladder did.
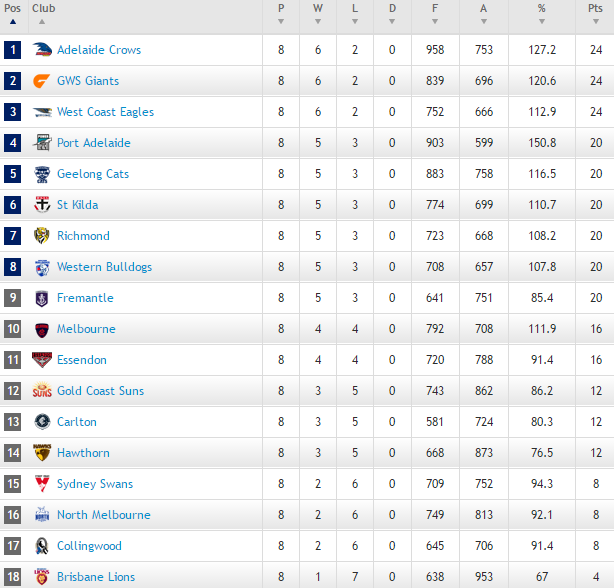
Fast forward to today and Port, the Crows and GWS have the three highest percentages. It would be hard to argue that those three don’t look eminently capable of winning the flag, even considering recent setbacks. Good teams are usually on top for longer and rack up bigger percentages in the process.
However, one shortfall of looking at percentage alone is that percentage is a product of goal kicking accuracy, which as I have written about many times before, tends to be highly variable for even the best players. A team may be playing perfect footy, restricting their opponents to only the toughest of shots, but if they keep nailing them from 50 out on the boundary, your percentage is going to take a hit through no fault of your own.
A solution to this is to look at the xScore percentage rather than the actual score percentage. Actual score percentage is the percentage ratio of points scored to points conceded. The xScore percentage is the percentage ratio of quality of chances created to quality of chances conceded assuming each chance is kicked at the AFL average for a shot of that type and position on the field.
Looking at the xScore percentage through the first 8 rounds of the year2 we can see a slightly different ordering.

Port Adelaide are a clear number 1 in both measures3, but it’s the Saint’s which make the most notable rise up the rankings under the new metric. They’ve created the 4th best xScore in the competition and conceded the 4th lowest. Conversion, both for and against has hid some of that dominance.
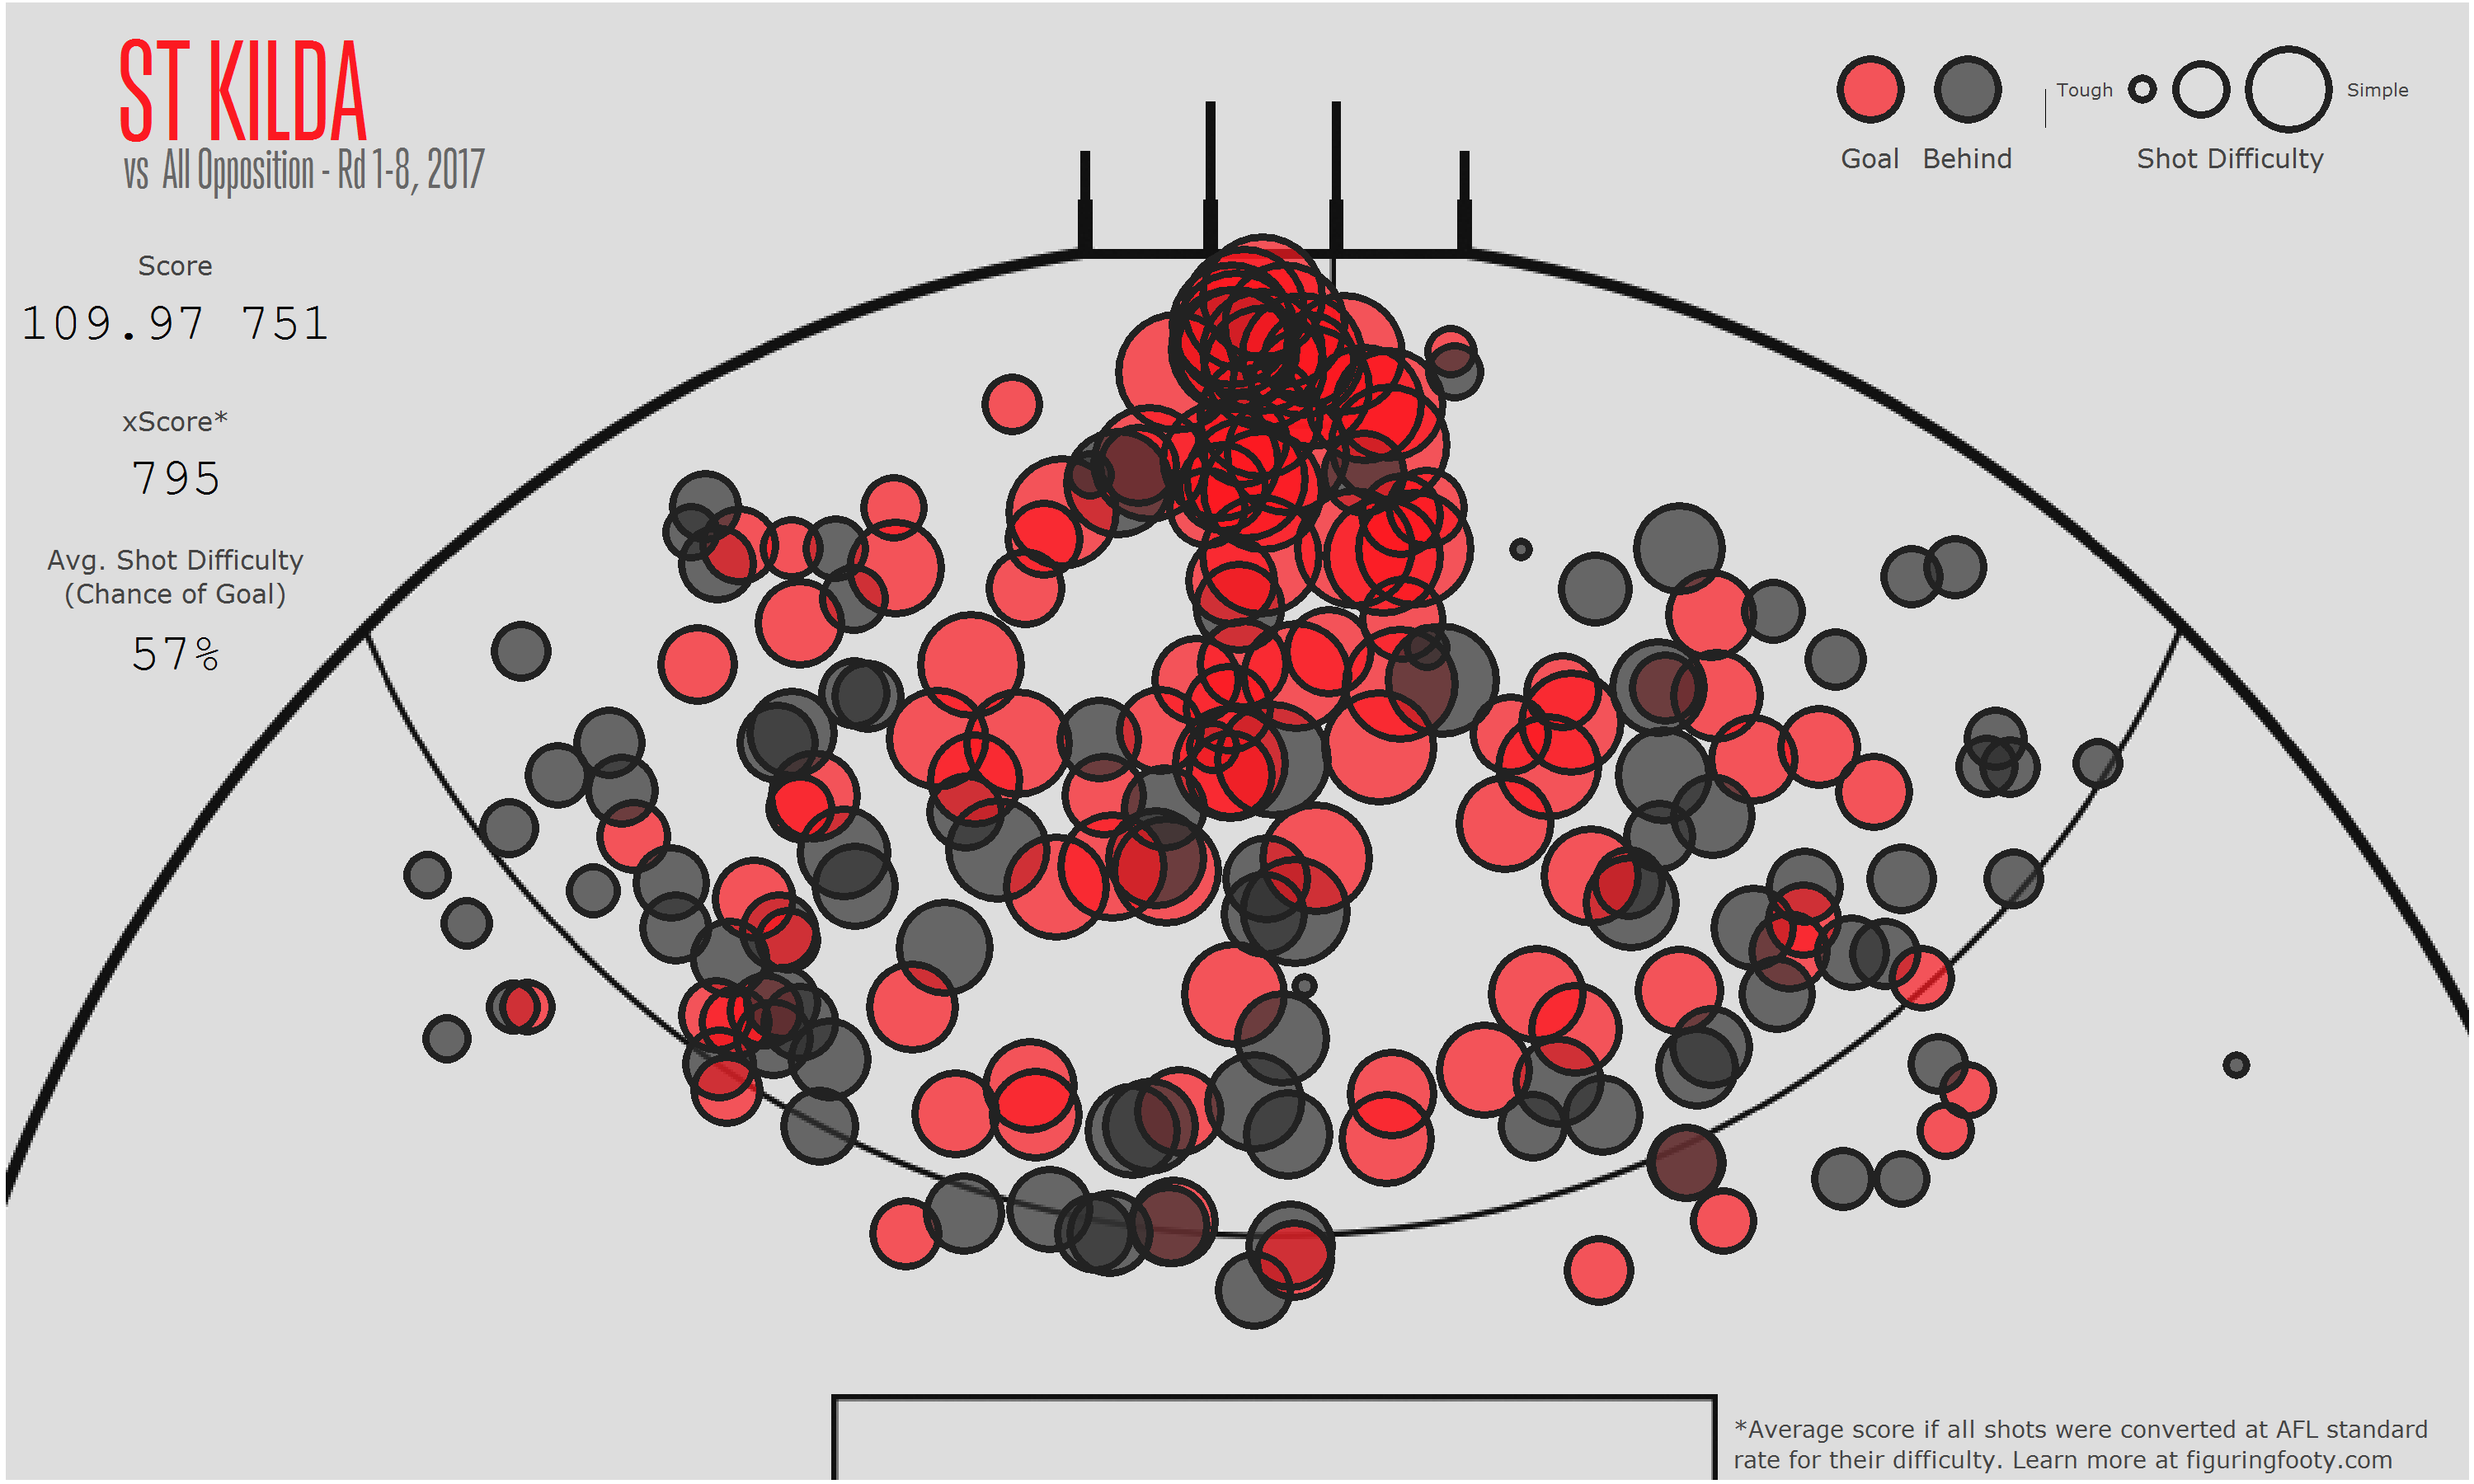
Here’s every scoring shot taken by the Saints so far this season.

It looks a bit messy4 but you can clearly see the high volume of shots taken in and around the goalsquare, a telltale sign of a very good team. The one thing that is letting them down is their splotchy conversion from anywhere further than about 30m out. If they had kicked at AFL average, they would have kicked an extra 44 points over the 8 matches. Although, to be fair, Josh Bruce’s shank walking into an open goal does explain 5 of those points.5
I understand the “bad kicking is bad football” argument, but past evidence suggests that these things tend to even out as the season goes along. For long term success you’d much rather be creating lots of good chances and losing the odd game than becoming reliant on your fowards kicking arrows to win you the game. Geelong snuck by early on good kicking and when that inevitably dried up, some worrying weaknesses have since been exposed.
At the other end of the field, the Saints have also been showing some good signs.

St Kilda have defended their “close in, directly in front” corridor well so far. However, their opponents have converted at a much better rate than average given their opportunities. Opposition sides have kicked 42 points more than the average side would be expected to given the types of shot taken and the locations these shots have been taken from. Often in this case you could make the argument that not enough pressure is being put on the goalkicker, leading them to kick straighter than they otherwise would. This breaks down when you consider opposition forwards are considerably outperforming their expectation from set-shots as well as snaps and other open-play shots. Given time this will change.
The Saints have created better quality chances (xScore) than their opponents 6 times this year. In all 5 of their wins and also in their loss to an incredibly accurate West Coast.6 If this result went the other way, they’d be sitting equal first heading into round 9.
The St Kilda ball movement into their forward line has been a joy to watch this year led in no small part by Steven, Steele and evergreen Nick Riewoldt. They are 3rd in the competition for inside 50 differential but kick more scores per entry than any other team in the competition. In recent weeks their midfield contested game has stepped up, winning the contested possession count in their last 3 games including a very impressive win over GWS.
You’d feel safe backing them in at home against the team in 15th place this weekend if that team weren’t somehow still Sydney. The Swans have some quality ins this week and if the Saints can manage to knock them off it’s time to talk about this team as a serious flag threat rather than just up-and-comers.
- Most of which I think is codswallop, but that’s an argument for another time.
- And bearing in mind that the quality of opposition each side has faced is different
- and I’ll certainly be having a much closer look at them in the next few weeks, so keep your eyes out
- 8 games is probably the limit for this sort of graph
- The xScore of that shot was 5.99, Bruce’s poster was worth 1.
- While the Eagles may have players like Kennedy who kick slightly above xScore over large samples, you only need to look back to last week against the Bulldogs to see that even good teams have off days when it comes to goalkicking. The Saints were simply unlucky to catch a team kicking 18.6 from shots.
[…] Figuring Footy has another excellent analysis based on shot quality, this time examining the Saints in particular: […]
Most interesting Robert,I shall await your next figuiring footy,cheers phil
Hi Robert, I really enjoyed your article. Out of interest – how did you compile the data for the set shots for each team?