

As seems to happen more often than not these days, the frantic, high scoring pace of the first couple of rounds has started to wear off, and strong, composed defensive efforts are once again having a big say on who’s winning games. As longtime readers will have seen in the lead up to the Grand Final last year, shot location data can give us a great idea of the capabilities and tactical styles of different defences in the competition.
However, that article was written at the end of the year, and it’s still very much early days in the 2017 season. It’s dangerous to make too many sweeping generalisations about teams without taking into account who they have played. One of my favourite footy sites, Hurling People Now, wrote an article last week about this very fact. Four rounds in, it’s very hard to compare a team like North who had played West Coast, Geelong, GWS, and the Western Bulldogs to a team like Richmond who had played Carlton, Collingwood, the Eagles, and Brisbane. Now with five rounds behind us, these season-long comparisons become a bit more valid, but like any stat you read, these should still be thought of in context.
Here’s a look at some of the best and worst defences of 2017 so far, with a little bit of insight into what’s working and what isn’t.
N.B. All Shots and Behinds figures are calculated after removing rushed behinds.
Richmond
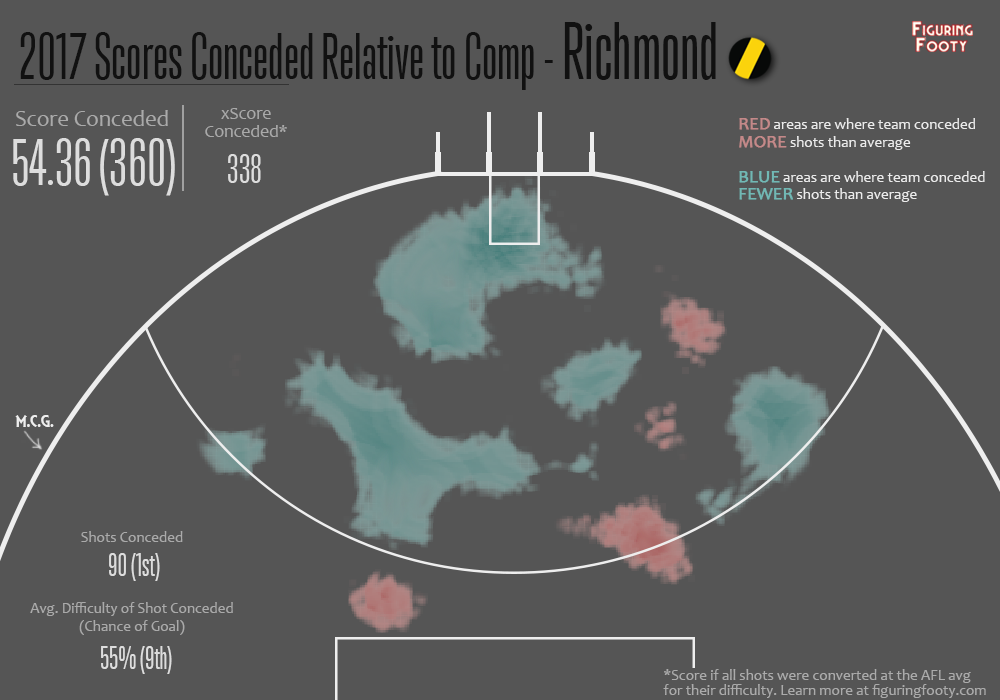
Even though the Tigers have had a relatively soft start to the year, they should be commended on their defensive effort. In the graphic above, blue splotches show areas in which the Tigers have conceded fewer shots than the AFL average. The darker the blue, the better protected that area has been compared to the rest of the comp. Red is the opposite. Showing areas which more shots than average have been conceded. The Tigers have a lot more blue than red.
They are first in the competition for (fewest) Shots conceded, Scores conceded as well as xScore conceded. A highlight of Richmond’s year so far has been their ability to stifle their opposition’s attack once it enters the 50. They have conceded the equal 12th most inside 50s so far this year, but once it gets in there, more often than not it comes back out without a shot being taken. The shots which they are conceding are low quality shots outside 50 and at tough angles. Alex Rance, Bachar Houli, and David Astbury have been among the Tiger’s best in defense so far this year.
It will be interesting to see whether they can keep up this record at Adelaide Oval this weekend against an all-out attacking Crows outfit. Something tells me that this is gonna be a bit tougher than Carlton at the ‘G.
GWS
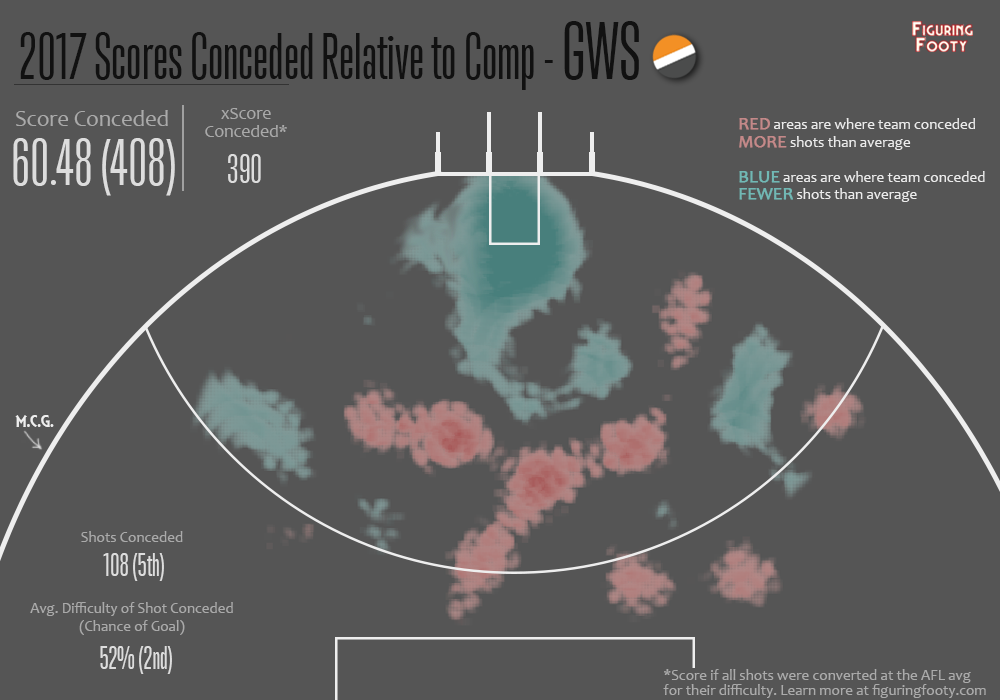
GWS have only conceded 4 scoring shots within 15m of goal so far this year, and only one shot from inside the goalsquare, a behind from a rushed groundkick. In fact, it’s been hard for teams to get anywhere within 30m of goal againts the Giants so far this year. They rank second behind Port Adelaide in restricting opposition to the hardest difficulty shots.
Like most great sides, the Giants hold their shape very well in defense, but their star-studded midfield must take much of the kudos. GWS have limited their opponents to fewer inside 50s than any other team in the competition. To pair with this fact, they also have the 2nd most inside 50s themselves. Despite a slight hiccup in round 1, the Giants are every part the complete football machine we expected preseason.
Adelaide

Considering they are known mostly for their incredibly talented forwardline, it might surprise you to hear that the Crows have conceded the second fewest scoring shots of any team in the AFL.
The core weakness of the fast-paced “sligshot” style Adelaide plays is evident in the above graphic showing that they have conceded considerably more shots than average from inside the goalsquare. In stark contrast to the Giant’s zero, the Crows have already conceded 11 goals from inside the square.
However, once you zoom out from that you can see the Crows defend the inside 50 corridor remarkably well, with tall defenders like Daniel Talia, Kyle Hartigan and Jake Lever limiting opposition marks in those high value set shot areas. So far opposition sides have been converting above expectation, if this regresses back to average, we can expect the Crows to win games by some very big margins this year.
Hawthorn

A healthy win last weekend may have got the media off Hawthorn’s back for a while, but their defensive numbers this year have been truly awful, and the amount of red in close to goal in the above graphic shows just how easy it has been for teams to create high quality chances against the Hawks in 2017.
No team has conceded shots with an easier average difficulty, and pairing that with the quantity of scoring shots they have conceded, it’s no surprise the Hawks have been on the end of some thumpings. They’ve had 23 goals kicked on them from within 15 metres of goal. They’ve also conceded 52 more shots than Richmond have. Over 10 more a game. Unless things can turn around in a big way, this is going to be a hard year for Hawthorn.
Brisbane

I’m still not entirely sure Brisbane know how to defend. The inside pairing of Stefan Martin and Tom Rockliff has been posting some elite clearance numbers this year, but beyond that they seem to be pretty much lost. Young side and all that I guess.
The one thing that can be said for the Lions is they at least limit their opponents to somewhat difficult shots. This, along with some unsustainable conversion up front had them somehow in front in the last quarter against the Western Bulldogs last weekend, a game in which they could’ve easily lost by 100 pts on another day. Poor conversion by their opponents has meant a tally of 79 goals conceded is actually flattering the Lions somewhat.
[…] Figuring Footy is using shot position data to study how different teams protect the big sticks: […]
Great read. Would be interesting to get this updated and even broken down into Rnds 1-8, 9-16, 16-23.
Good suggestion. Will continue to look at accuracy as the season goes on.