
Followers of this blog have likely read my thoughts on the lacklustre state of AFL analytics, both inside clubs and throughout media has a whole. The obvious question that comes to mind after reading those pieces is: If analytics and stats aren’t being used to their full ability right now, what exactly would *you* do to use them any better? This series of articles hopefully begins to provide an answer to that question.
These articles are framed as an “analytical preview of teams before each final”, but in reality I will be using them as a way to introduce some new concepts, visualisations and ideas about the general direction in which I think good footy discussion should be moving. (If you’re looking for in-depth, tactical discussion ahead of each match, Nick Welch at Madness of Sport has been doing some good work.)
Each article will have something you haven’t seen before, patched together from rough work I have been doing over the last few months. Hopefully you can see the wide-reaching applications for some of this stuff as well as learning a thing or two about the AFL finalists
Other posts in this series:
Adelaide v North Melbourne (Shot Locations Heat-Map and Age Profile)
Geelong v Hawthorn (Score Involvements and Close Games/SQP)
Sydney v GWS (Forward Reliance/Leading Areas and Team Ratings)
West Coast (Mark Positions)
One of the things I noted last week when writing the Coleman Medal recap, was that Josh Kennedy sure takes a hell of a lot of marks. Thinking that there may be something to that, I ran a quick scan of my numbers to see which teams kick the majority of their scores through set-shots and which have a more free running, “play-on” style about them.
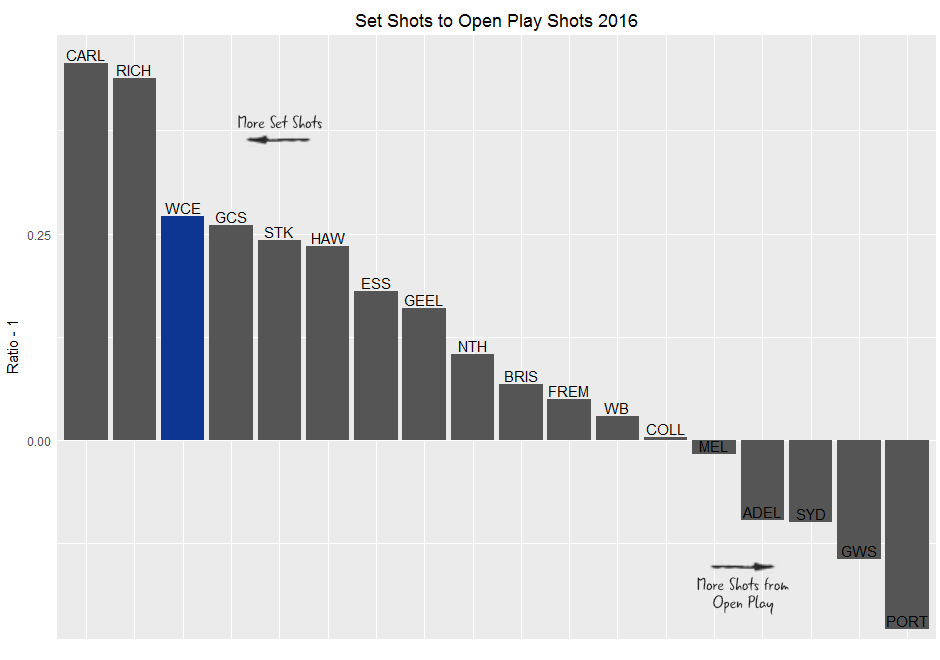
The results did not surprise. West Coast have the highest set-shot to open-shot ratio of any of the finals sides. 1 Adelaide, Sydney and GWS all create more opportunities from open play than they do set shots, perhaps not a surprise for the sling-shooting Crows.
Looking further into the Eagles, we can see that the majority of their set shots come from their two “big” forwards Kennedy and Darling.
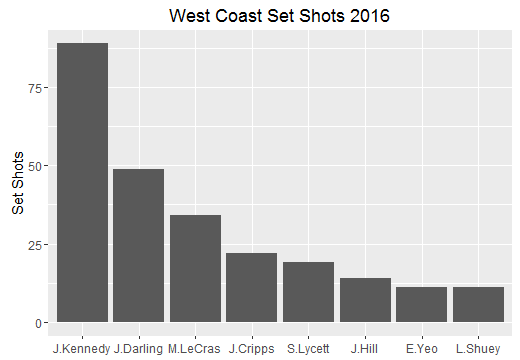
Together Kennedy and Darling have kicked 88 of West Coast’s 177 set shot goals. These two players account for almost half of the team’s production kicking over the man-on-the-mark. Stopping them from doing this, is obviously a very big key to stopping West Coast from winning.
Visualising where on the field all these marks and free kicks that lead to scores happen is a big step in the right direction to work out how to close this pairing down.
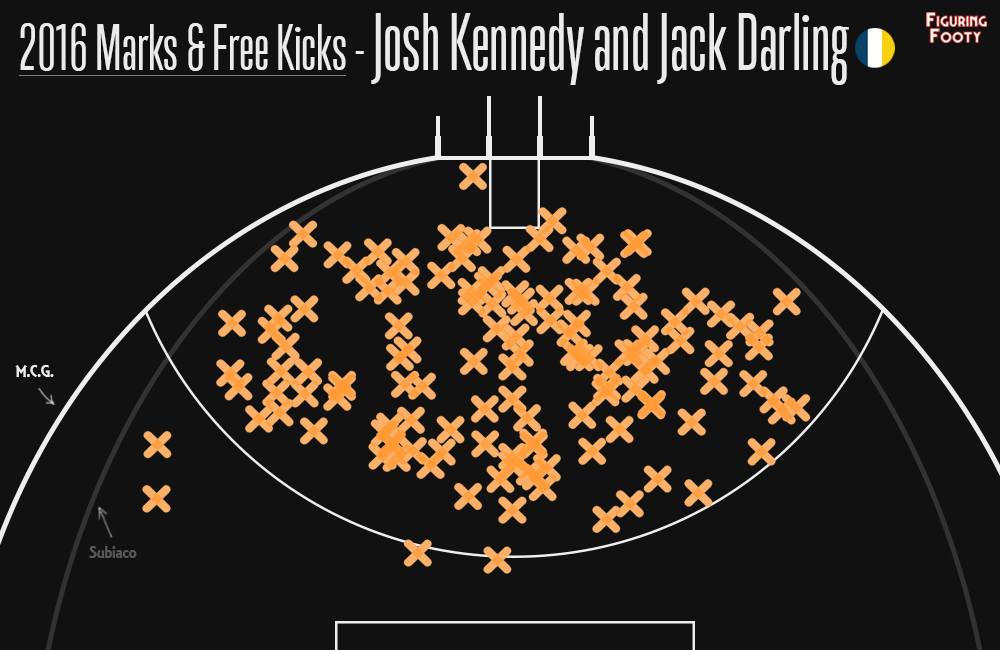
It looks as if this is a pretty random spread throughout the 50. However, that in itself is more telling than we may originally think. Lots of teams still rely on one of the old fashioned stay at home big forwards. One who specialises in contested marks one out, and also crashing the pack and provide a “bomb it long” target if the midfield have nothing to kick to.
West Coast, for the most part, do not get sucked into this style of play. They have a skilled midfield who kick out in front of the forward and honour hard leads, not a midfield who just kick it to the top of the goalsquare and hope a big forward can do something special.
Stopping West Coast involves applying high pressure on their midfield feeders and having big, quick defenders who can follow out a forward and spoil from behind. All easier said than done, but the Bulldogs just might be able to challenge them in the midfield and could well get it right on the night.
Western Bulldogs (Player Tracking)
I want to take a moment to talk about the future of analytics. What I’m going to be discussing here I have neither the setup nor the data to do myself. In fact, nobody has. It doesn’t exist yet. But that is all changing very soon. (Sorry to Bulldogs who wanted to see me dissect their team, hopefully next week, hey? As a consolation at least you’ll get to spend the next couple of minutes admiring one of the most exciting young talents in the competition)
Watch this goal by Lin Jong:
Jong goes long to sink the Magpies! #AFLDogsPies #ohwhatafeeling https://t.co/IV8Ua0SKX5
— AFL (@AFL) August 12, 2016
Now watch it again. But this time watch Bontempelli. Watch him take the ball at high speed. Watch him tuck it under his arm and actually run towards the Collingwood players. Watch him draw all 4 of them to him before shooting off a handpass just at the perfect moment. This is what made that goal.
Traditional statistics are very poor at judging this sort of influence. Bontempelli would be credited with a handball receive and a handball assist. Even with the most detailed data we have2 we could do very little to rate the impact and skill of this play.
However, that will soon be changing. From next year, Champion Data will be collecting widespread player tracking data for the first time. This will simply involve GPS readings from each of the on-field players, but will change the way we think about footy entirely.
We will be able to judge the speed at which Bontempelli took the ball. We will be able to see the positioning of each of the Collingwood players and just how they were “taken out” of the play. We will be able to see the exact amount of time and space Lin Jong was afforded in order to kick his goal. We will be able to see the skill and talent that goes into executing a play like this and compare that talent to other players in the competition.3
Contested possession and clearance numbers don’t do a player like Bontempelli justice, player tracking numbers will.