
I have been playing around with different types of data visualisation lately, particularly visualising scoring shots. I’m hoping to clearly see the quality of chances each team created to get a better idea of the styles they are playing and also their finishing ability. I previously looked at Goal-Kicking Accuracy in a very general sense and found that every team converts at more-or-less the same percentage (Goals/Behinds) in the long run. However, in that post I didn’t consider the quality of chances created, which is something I plan to spend much more time on in the future.
Another Year of Brown and Gold
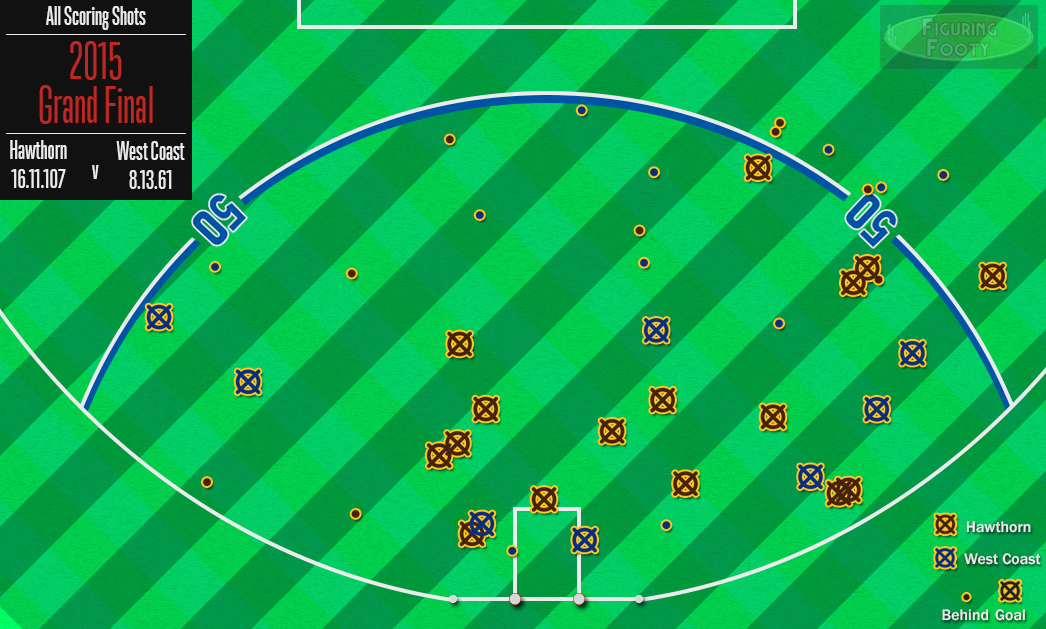
Saturday’s Grand Final gave me an excellent opportunity to try out a new little plot. Below is a picture showing the field position of every point-scoring attempt during the game. I’ll do a quick little analysis of the game and briefly explain what I think this sort of visualisation helps us understand about the result, but for the most part I’ll let you draw your own conclusions. Words are clunky and far too often tiresome, good visualisation should tell it’s own story.
Before I get into it, I should point out that map only displays attempts that troubled the scorers. Shots that finished out on the full (from memory, only Rioli’s first quarter effort) or those that didn’t carry the distance and were not knocked through by the defenders are not shown below. Rushed behinds without any genuine attempt by a forward are also omitted.

A few points:
- After accounting for rushed behinds, Hawthorn won the Scoring Shots 25 to 19.
- Overall, they were also clearly more accurate in front of the sticks. They converted 16/26 = 64% of their chances to West Coast’s very underwhelming 8/19 = 42%. Having watched the game one could be very quick to attribute this to the Hawk’s defensive pressure but the Eagles kicked only 3 of their 8 (scoring) set shot chances. Their poor kicking invaded all facets of their game. Maybe the occasion got to them? At one point late in the 2nd, they were 2.8.
- Hawthorn were deadly from open play. Kicking 5.5 from set shots, the bulk of Hawthorn’s goals came from open play. 11/15 = 73% of those scores were goals.
- As you can see in the picture above, Hawthorn’s domination wasn’t all due to accurate kicking. The number of high quality chances the Hawks created was far greater than the Eagles. They managed to create 9 chances within 25m of goal to the Eagles 4.
- That being said, West Coast really did blow some opportunities. Josh Hill’s disaster running into an (almost) open goal will certainly hang long in his mind, but he was far from the only one in blue and yellow to miss what he should have kicked. Looking only at the areas where conversion is typically above 70% (that is, close into goal and up through the corridor), West Coast kicked 3.6, around 30%. Hawthorn kicked 9.3 in this area. Of course this only includes shots that actually registered a point. If I recall, Luke Shuey failed to think through a couple of chances running into the 50 that should really have resulted in goals, and Jack Darling dropped a chest mark 30 out right in front. None of this shows in the image, but it certainly played a major role in the final result.
- Lastly, an interesting little titbit we can see from the mapping the data in this way. Only 1 goal was scored from outside 50. Even that barely counts as a big shot, as the Isaac Smith effort was shepherded through on the bounce by Luke Hodge in the goal square.
All in all, I think the map shows really well how the game was won. Hawthorn worked the ball into very good areas and capitalised when they were there.
If you have any questions, or want to provide your own spin on the results please comment. I hope to keep myself busy working hard in the off-season and have even more fun statistical toys to play with when footy comes back after its long break.
Nice work.
Where did the data come from for the position of these shots?