
Last article, I looked at how important Goal-Kicking Accuracy was to the chances of winning a match of AFL footy. It turned out that it was very important, teams that kick straighter very often end up winning. Unfortunately, in investigating this I also found out that repeating a straight kicking performance week-to-week with any sort of consistency doesn’t really happen. Goal-Kicking Accuracy is pretty much a crapshoot. Sometimes you’re on, sometimes you’re off, with no real rhyme or reason.
This naturally leads us to our next question. If kicking straight is not repeatable, what skills are? Why do some teams win much more often than others? What areas of the game do they excel in that are repeatable week after week?
Seeing as kicking more goals than your opponent is really the name of the game, and we now know accuracy is so variable, let’s start in the simplest place possible by looking at the number of scoring chances a side creates. While we’re at it, let’s also see how well they limit their opponent’s scoring chances. Is this where true, repeatable team talent lies?
Unfortunately, I don’t have detailed stats on every kick made in the forward line and what the intention of the kicker was, so I’m going to have to make do with the number of scoring shots registered as an indication of how many chances a team created. I will boil down the the scoring chances a team creates, while limiting the chances it concedes, into one very easy to calculate figure, Scoring Shot Difference (SSD):
SSD = (Goals Scored + Behinds Scored) – (Goals Conceded + Behinds Conceded)
Don’t be scared by the formula. This is simply how many more scoring shots (SS) you had than your opponent. Or conversely, if negative, how many less you had.
Do Some Teams Consistently Create More Scoring Shots than Others?
Later on I’ll show just how important a positive SSD is to winning a match. But let’s first see if it’s a repeatable skill. That is, let’s see if we have some teams with consistently higher (or lower) SSDs than other teams in the competition. This may seem trivial. But remember, we are trying to find specific stats to help us rate teams in the competition. Being able to repeat a performance consistently is vital to showing us exactly where a team is at. Our metrics must show repeatability.
NB: The results below are based off scoring data from every H&A game played between 2003 and 2014.
Week-to-week correlation
Unsurprisingly, the relationship between a team’s SSD in one round and the SSD they achieve in their following match is very weak. The linear regression model gives an r² value of around 0.05 (more on what this means later). There are just simply too many factors that vary week-to-week that can affect how well you are able to both create scoring chances and limit your opponent’s scoring chances. Chief amongst them, opposition quality. It’s obviously much harder to log a high SSD against a stronger team. Accounting for opposition strength will be something I explore in more detail in future posts.
I have also run linear regressions on the correlation between SSD in the current match and the average SSD over the last 3, 6 and 9 matches in the season as well as the average for the entire year-to-date and this same average applied only to games from Rd 10 onwards (when season av SSD can be expected to settle down to a more true average). The results from these regressions can be seen in the table below.
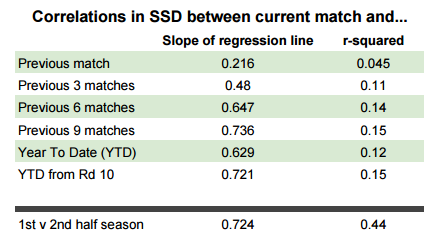
We can use the slope of the regression to infer an average expected SSD for the current game given our averages for the previous matches. For example, the expected SSD in a team’s next game is on average about 73% of whatever the 9 match rolling average SSD is for that team. However, the standard deviation is so high that this prediction is not really accurate at all. The best we can say with any sort of confidence (using the ± 2 sd rule) is that the SSD will be within about ± 20 SSD of this value, ruling out only the most extreme of cases. This is not really helpful in game to game prediction. Knowing that our team is likely to create somewhere between 25 scoring shots more or 15 scoring shots less than their opponents is nothing to phone the papers about.
But we’re still measuring SSD for one game. As I said before, there is so much variation that is attributed to the strength of the opponent and things like home ground advantage and ins-and-outs that we can’t really expect one number to model our expected Scoring Shot Difference against the best team in the comp on the road as well as against an easybeat team at home.
When comparing the average SSD for the first 11 games of a season (1st half) to the average SSD for the last 11 games (2nd half), rather than just one game, you can see the correlation coefficient, r² rise considerably. An r² of 0.44 means that SSD for the 1st half of the season can help explain about 25% of the standard deviation in SSD for the 2nd half. We can now predict average SSD for the 2nd half of the season with relative confidence to within ± 9 SSD. Not amazing. But getting there.
Season-to-season correlation
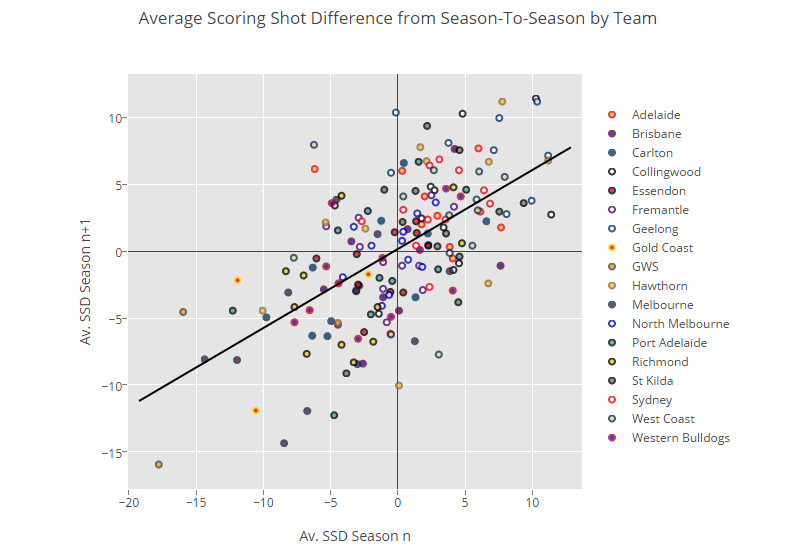
Is the average SSD of a team in one season a good predictor of their SSD in the next? I’ve posted an interactive plot below with data points for every team in the competition over the last 12 years. The x-axis is how they performed in the first year and the y-axis how they did in the following. (Click on the team names to add/remove data and scroll over to see more detail.)
https://plot.ly/~CheesePlease/194/average-scoring-shot-difference-from-season-to-season-by-team/
I’m not going to say too much about this. I’ll let you muck around with it and come to your own conclusions. But just bear a couple of things in mind:
We do not expect a complete, perfectly correlated relationship. In fact, if we had perfect 1:1 relationship season-to-season it would mean that our teams are performing exactly the same year after year. This is obviously not true. With the equalisation policy in the AFL (particularly both the salary cap and the priority draft pick systems) teams have periodic fluctuations in strength as the years go on. The bad get better and the good come back down to earth. Our metrics should reflect this.
Despite the fact that there is a clear correlation between SSD in one year to the next, there is still a huge amount of variance present in that data. Let’s say you average +3 SSD in one year. Your value next year could really be anywhere between +10 SSD and -5 SSD.
Finding how much of this variance is in fact predictable (through the use of information such as team sheets, game strategies and other stats) and how much is just random noise will be my long-term goal for this blog. And don’t worry, I have some very interesting things in the works that will hopefully provide much clearer prediction. But for right now I find it encouraging that there is at least some year-to-year correlation in a team’s average Scoring Shot Difference.
What is the effect of SSD on the result of match?
It’s time to find out just how important SSD is to actually winning matches. In fact, you’ve probably already got a sense of it from that Plot.ly graph above. The top is dominated by Geelong, Hawthorn and Collingwood, while the bottom has a lot of GWS and Melbourne points.
Just like I have done previously for Goal-Kicking Accuracy, I’m going to look into a few different methods of assessing how important Scoring Shot Difference is to the result of a game.
Win Percentage for Teams with Positive SSD
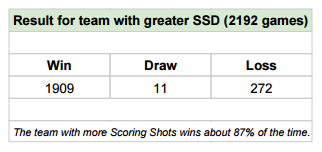
Looking at all H&A games from 2003 up until Rd 10, 2015 we can see that in each individual game, the team that created more Scoring Shots, ended up winning around 87% of the time. This is higher than the 65% of games the team with greater accuracy wins, suggesting the SSD might be a very good measure for the overall ability of a team.
Bear in mind though, that these two figures are intrinsically linked. In the 13% of games that the team with higher SSD loses, the opposition, by definition must have had greater Goal-Kicking Accuracy.
Average SSD of Winners
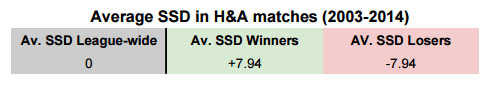
In an individual game, SSD for both teams combined is clearly symmetric around 0. It sums to zero. If one team creates an extra scoring shot than the other necessarily concedes an extra shot. Still, it might be interesting to know that the team that wins has historically created an average of almost 8 more Scoring Shots than their opponents.
How do your Chances Improve with each Scoring Shot?
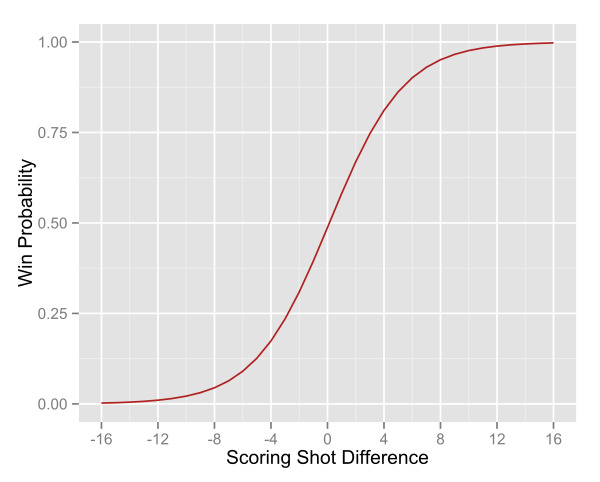
Above is the graphical output of a binary logistic regression of SSD to the final result of each match in the database.
Notice the shape of this curve, in close games an extra scoring shot either way can result in huge changes in the probability of actually winning. In fact, take just 3 more scoring shots than your opponent and you’re likely to win 3 out of 4 times. Once again, those games that you don’t win are due entirely to poor GKA, so goal-kicking is still very important, but it is nice to have a simple metric so heavily related to winning that has at least some obvious skill level associated with it.
Summary
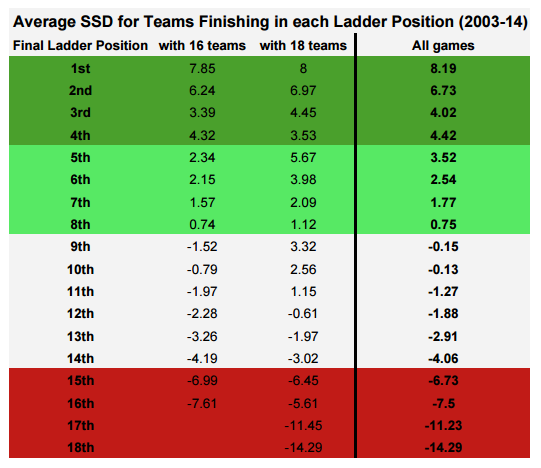
Hopefully by now I have convinced you that scoring more shots than your opponent in a single game gives you a huge increase in your chances of winning that game. And also that this is a skill that can be repeated with a certain level of accuracy throughout the season. In the coming weeks I’m going to be answering a very closely related, but crucially different question. Can you use a team’s average SSD to rank them against other teams in the competition? What’s the best way of doing this? Do great teams always have great SSDs?
To give you a taste of what’s to come I’ll leave you with the average SSD over the season for each team that finished in each spot on the ladder since 2003. Bear in mind that there have only been 4 full seasons with 17 teams and 3 with 18, so I’ve also included pre and post Gold Coast/GWS averages in there too.
Below is a collection of comments, musings, questions, figures and analyses that for whatever reason didn’t fit into the article. If you’re interested in reading more about the statistical processes involved or joining the discussion, this is your place.
It should be noted that in that in the logistic regression giving empirical win probabilities, draws have been excluded for convenience.